Since the year 2000, 52% of the Fortune 500 companies have disappeared from the rankings – largely as a result of digital disruption. Now – more than ever – it is essential to remain current. For many companies, it’s come down to a case of survival of the fittest.
At the outset, it’s worth mentioning that continuous focus on the portfolio management of business units and a cadence of regular, small divestments is typically less disruptive than a blockbuster “mega divestment” – or divesting of multiple business units at once – due to the risk this brings, and the disruption caused.
It’s also important to be cognizant of the message sent to the market when it comes to divestments.
For instance, regular, small divestments can convey that management have things “under control”. Conversely, a blockbuster divestment can signal bad news (even if this is not the case – remember, there is asymmetric information when it comes to the relationship between company executives and market investors). The worst-case scenario – and the one to avoid – is of a distressed divestment – where management could have taken action much earlier to course correct.
The takeaway here is two-fold – (i) focusing on core business units allows an organization to communicate a clear and compelling growth story and (ii) selling “when you have to” is too late.
Framework One
This first framework could be used by any company that is aware of the need to change and cull some business units, but is unsure of where exactly to start. The idea is that all business units are mapped out on a strategy canvas against the overarching criteria of performance and strategic fit.
Both performance and strategic fit could be the sum of a number of metrics and, therefore, represent an aggregation. For instance, under performance, a company might consider KPIs such as revenue, revenue growth, return on capital employed, cash generated from operations, etc. These KPIs could even be weighted. Strategic Fit could be an aggregation of metrics such as geography, product/service offering, risk profile, etc. Again, these could be weighted.
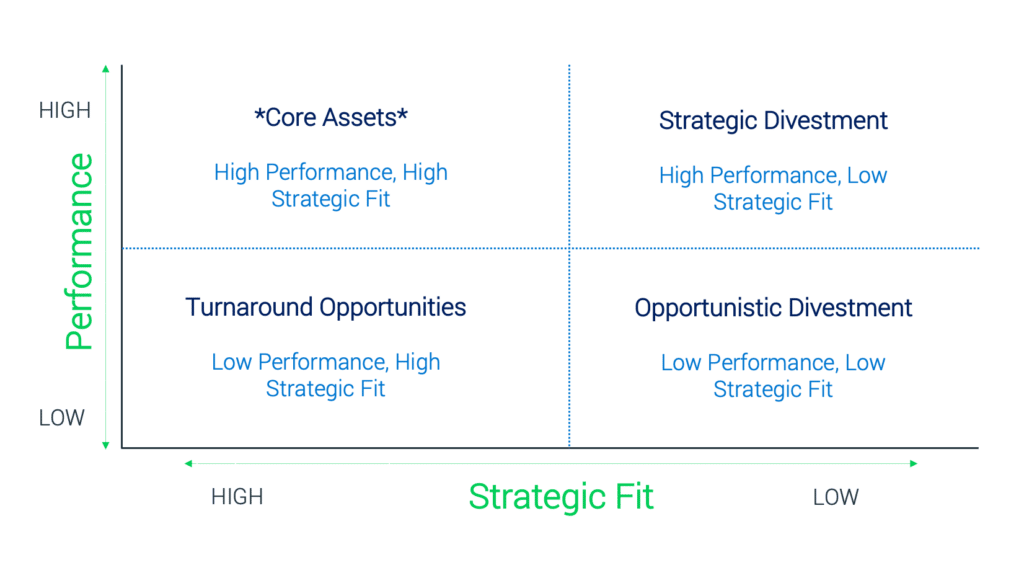
Core assets – or business units – are, as the name implies, part of the company’s core. These business units create value and should not be divested of in the near-term. They should, however, be monitored (i.e. it’s important to not become complacent and assume such business units will always be core given how markets change over time).
Strategic divestments are associated with business units that create value and generate cash, but which don’t fit with the long-term corporate strategy. Such business units have a good reputation in the market – so a fair market value should be achieved on sale. It’s important to not hold onto these types of business unit for too long and risk value erosion.
Turnaround opportunities are associated with business units that have exhibited negative performance over a sustained period (i.e. they are not generating value and/or consuming cash and resources in an unsustainable way). The priority here is to get performance back on track and move these business units to becoming core to operations. Turnaround options could include re-branding, re-location of manufacturing facilities, targeting synergies with other business units or focusing operations on markets with strong demand.
Of course, turnaround will not always be possible – in which case divestment should be considered as a possible course of action. Crucially, decisions pertaining to turnaround opportunities should be made early enough in the divestment process to avoid a distressed sale situation arising.
Opportunistic divestments are associated with business units that are not aligned with a company’s strategy (e.g. across products/services or geography), which exhibit low performance and overall, are not contributing. They should be divested of as a priority.
Framework Two
We are, of course, looking at the famous framework devised by the Boston Consulting Group. The horizontal axis represents the market share of a business unit and its strength in the particular market. By using relative market share a company can approximate competitiveness. The vertical axis represents the growth rate of a business unit and its potential to grow in the particular market.
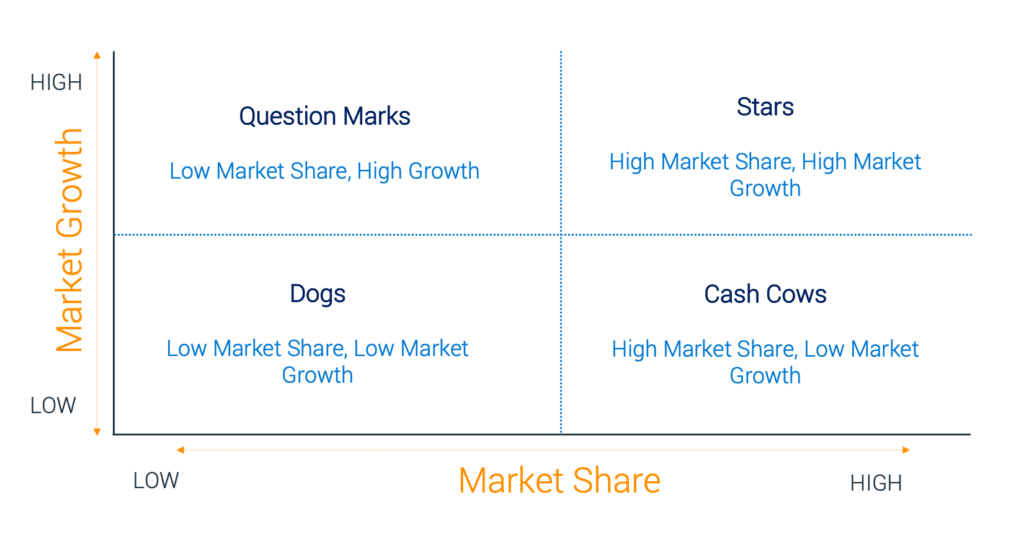
Questions marks are associated with rapid market growth but low market share. Question marks are time-intensive and require significant investment and resources to increase their market share. Investments into question mark business units are typically funded by cash flows generated from so-called cash cows. Ideally, a company would turn question marks into stars. If this doesn’t happen, question marks may end up becoming so-called dogs when market growth inevitably declines.
Dogs are associated with slow market growth and low market share – a good example could be legacy technology in the stages of being phased out within a once-buoyant market. In the near-term, dogs are typically able to sustain themselves and provide cash flows, but will never become stars and could become a resource drain in the future. Companies typically phase out business units identified as dogs unless they are complementary to existing business units or should remain for competitive purposes.
Stars are associated with markets that are growing quickly and where there is high market share. While stars may be perceived as market-leaders, they might require significant investment in order for market share and competitive advantage to be maintained. Stars usually consume a significant amount of cash – but while also generating large cash flows. As the markets mature, stars will typically transition to becoming cash cows.
Cash cows are associated with slow growth but high market share. Such business units have already received a significant amount of investments but crucially, do not require significant future investments to maintain their position. Cash flows generated by cash cows are high and generally used to finance stars and question marks.
Framework Three
This is another framework to consider when it comes to the divestment decision making process – similar to the BCG framework. The idea is to focus on market attractiveness and financial performance in order to ascertain how to prioritize capital allocation or whether to divest.
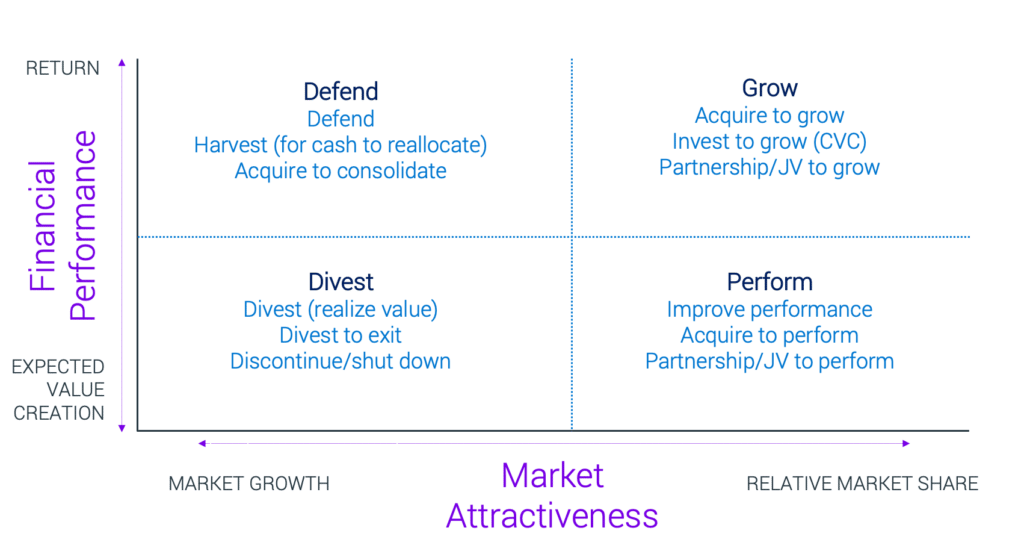
Market attractiveness is defined by forecast market growth and a business unit’s current relative market share – being the opportunity for growth and how well positioned a business unit is to capitalize on this. Financial performance is based on current returns and the opportunity for future value creation.
Business units in the grow quadrant may deserve an unduly high share of capital expenditure (e.g. to increase market share or to consolidate market position). In addition to allocating a high proportion of capital to existing business units, companies would be wise to consider acquisitions of targets in industries within the grow quadrant.
Business units in the perform quadrant require capital investments in order for potential to be realized and for financial performance to improve. This could be achieved via acquisitions to gain economics of scale or new capabilities, etc. It’s notable that these business units might be regarded as highly sought-after divestment targets, given the potential for growth and improvement.
Business units in the defend quadrant generate cash via exhibiting a market-leading position or competitive advantage. Such business units contribute to their counterparts in the grow and perform quadrants. Depending on the sector vertical, consolidation might be required to maintain the financial strength of these business units as market dynamics inevitably shift over time.
Business units in the divest quadrant add little value to today’s operations and are not expected to do so in the future. Furthermore, these business units might be responsible for inefficiencies in capital allocation, particularly if they are capital intensive but not growing, or if they increase portfolio complexity or risk. A well-diversified organization should reduce or discontinue capital investments in such business units and consider divestment.
For more on divestments see Midaxo’s Comprehensive Divestment Playbook.
For more in-depth information, please watch the recording of a webinar on best practices and running divestments in Midaxo.