Intro:
Tracking pipeline metrics goes a long way to providing a constant health check of M&A and corporate development initiatives. Doing so can provide valuable insight into the number of potential acquisition targets being evaluated & in what stage, why targets are being rejected, where things are being held up and how a company is tracking towards achieving its overall corporate development objectives.
If this reporting discipline is currently missing from your acquisition strategy, it’s surprisingly easy to change your ways via a digital platform that features an M&A pipeline management tool.
Step 1 – Recognizing the Need to Change
Producing pipeline reports to monitor M&A/corporate development progress in a manual way might be what is most familiar to many deals teams, but this approach is no longer fit for purpose. Rather, deal teams should be able to check the pulse of an M&A pipeline and progress against corporate development objectives at any given moment – and therefore, should move from reactive to proactive reporting.
Taking the traditional (or analogue) approach to M&A pipeline reporting, as soon as a report is created it becomes out-of-date as new information becomes available. Furthermore, depending on the scope of M&A deal process activities within a company and the volume of data to hand, the analogue process of compiling meaningful – and actionable – pipeline reports can take hours or even days.
Let’s take the scenario of a multinational conglomerate evaluating 500+ targets per year, with a number of individuals in a deal team working on deal origination activities and logging target evaluation outcomes (e.g. strategic/financial fit, reason for rejection and the ultimate go/no go, etc.) in different ways. In this given scenario, chances are, if the head of corporate development/a member of C-suite asks for the details of how many targets have been rejected in the due diligence stage over the past year – and why – or what the split of targets by deal rationale is at any given time, the information will not be readily available. Yet it should be – and can be – in real-time and via a few clicks with automated reporting.
Step 2 – What You Need to Track & Why
1.Reason for Targets Being Abandoned/Put on Hold
Why? Understand the reason for targets being abandoned/put on hold – e.g. (i) is this largely under a company’s control and due to poor internal deal sourcing (ii) attributed to poor opportunities being introduced by intermediaries (e.g. by investment banks) (iii) due to poor fit (e.g. across strategy/financials/products/services, etc.) (iv) are targets not proceeding beyond due diligence or (v) are market drivers out of a company’s control at play (e.g. such as valuations being driven up, thus putting targets outside of an acceptable valuation range).
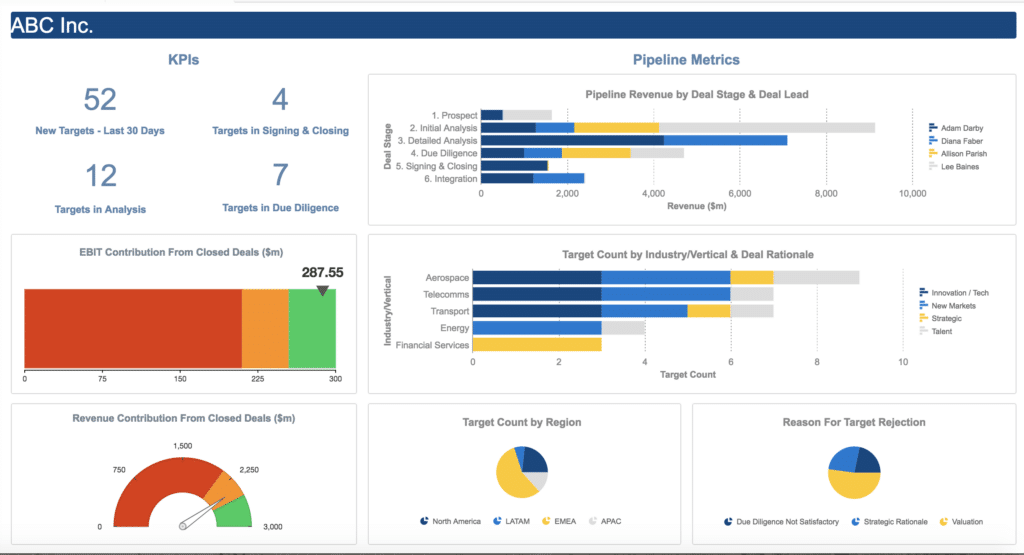
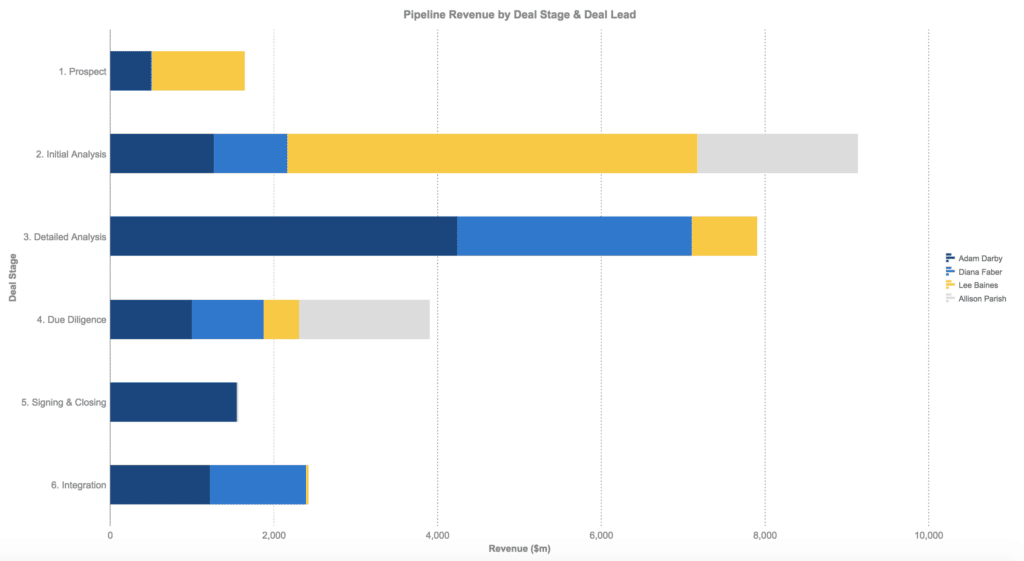
2.Overall Pipeline Value (by Revenue), By Deal Stage
Why? Shows the potential revenue contribution attributed to targets in different deal stages. e.g. if most of the pipeline value (by revenue) is derived from targets sitting in the early Prospect stage (rather than further along the pipeline, e.g. in Due Diligence) it is possible that targets may be moving through the M&A pipeline too slowly (which poses the risk of corporate development objectives – such as revenue growth via M&A – not being met if, ultimately, deals are not closing).
Conversely, for targets in the Signing & Closing and Integration stages, this shows the definite revenue/EBIT, etc. contribution deriving from M&A activity – therefore providing teams with the assurance that M&A is delivering against objectives (or alerting them to the fact that it is not).
3.Split of Targets by Value Driver/Deal Rationale (e.g. Growth/Innovation/Talent)
Why? Helps a corporate development or deal team to understand the composition of a pipeline by way of a strategic focus and establishes if resources are being allocated to the right mix of targets based on strategic goals and industry focus or if there is bias to certain deal types (which may or may not align to the corporate strategy or be proving problematic when it comes to closing).
Additionally, this metric provides a company with oversight of all potential deals and where the primary focus is at any one time, which only helps with M&A pipeline management.
4.Time to Move A Target Though the Pipeline
Why? Helps a corporate development/deal team understand how quickly (or slowly!) targets are moving through the M&A deal flow. If target evaluation is taking too long this poses the risk of working data being out of date, the pipeline becoming “stagnant” and/or could result in competitors reaching exclusivity and ultimately closing on a target (this is particularly relevant for sectors in high demand, where there could be competitive tension between potential buyers).
Tracking this metric also reveals how efficient target evaluation is and at what pipeline stage progress is being delayed (e.g. due to an overly long due diligence review or protracted signing & closing process as a result of SPA complications, etc.).
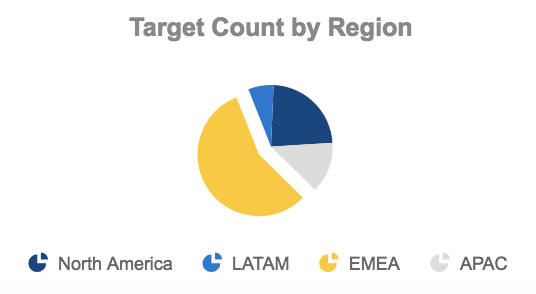
5.Targets by Geography
Why? Helps a corporate development/M&A team understand the composition of the pipeline by geographic/region focus. This can be important in the case where geographic diversification is a strategic goal – not only for when a company is looking to expand across or enter into new markets/international market entry, but for global oversight of all potential deals as part of their global M&A strategy.
6.Progress Against Growth Objectives
Why? The primary goal of most companies pursuing M&A is to achieve the objective of growth and to provide an area of expansion that will add to the product/service line – perhaps in a market that is currently not served by the company. Given that M&A is intended to move a company forward – and that corporate development growth targets can be aggressive – it’s important that progress against objectives/operational KPIs can be monitored in real-time.
Key growth metrics may be financial and include revenue and EBIT contribution from closed deals, etc. but could also be more qualitative – such as in relation to the number of employees on-boarded as part of an acquihire. Ultimately, if you have a metric you wish to track a Smart M&A Platform can handle it.
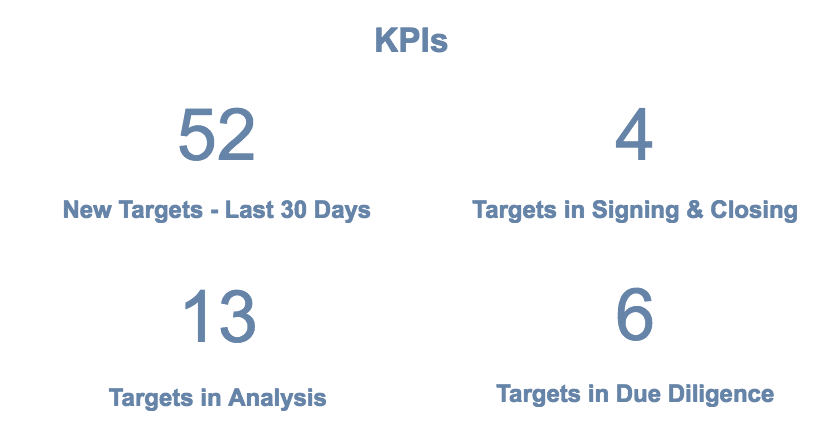
7.Target Count Per Deal Stage
Why? Helps a corporate development/M&A team understand how productive those working on deal origination/target evaluation and highlights the project owners that are consistently doing a good job of pushing targets to the next stage of evaluation. Additionally, tracking this metric helps identify whether a company needs to increase its deal origination activities so as to meet corporate objectives.